Most QA managers have been here. Build is done. Stakeholders want a green light. You open your tool, look at pass rates and defect counts. And still have no idea if you should ship.
That is not a data problem. That is a tool problem.
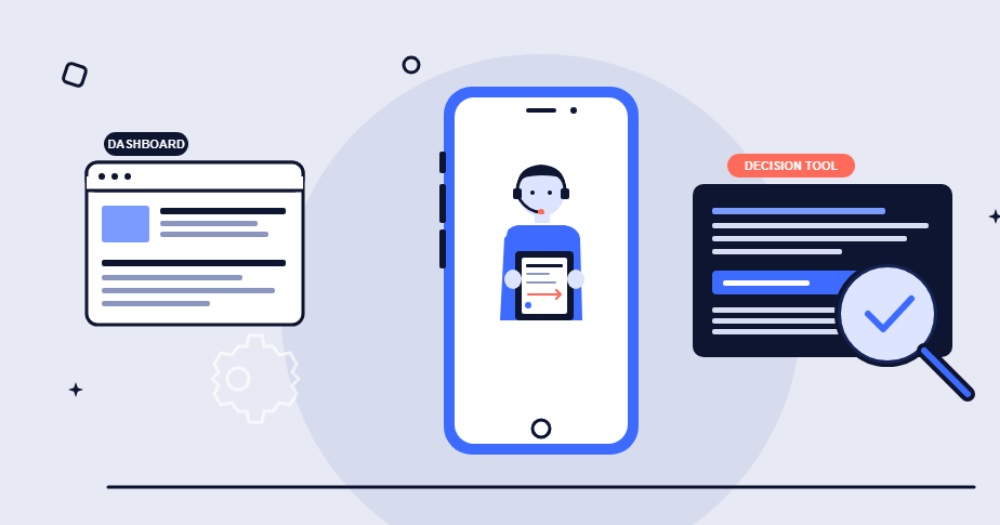
What a Dashboard Actually Tells You
Dashboards are useful. Nobody is arguing against having one. The issue is what they are designed to answer, and what they are not.
It Answers Yesterday’s Question
A QA dashboard tells you what happened. That is it.
You get test results, open bugs, maybe a burndown chart. It is a rear-view mirror. Fine for reporting. Not enough when someone needs you to say the build is ready.
The real pressure before a release is not about visibility. It is about accountability. A screen full of metrics does not tell you if those metrics mean you are safe to ship. You still have to interpret, cross-reference, and make a call. With your name on it.
The Questions Dashboards Do Not Answer
Most QA tools are built around execution. They show what ran, what passed, what failed. Some add trend lines. Very few answer the questions that actually matter before a release:
- Which requirements have no test coverage right now?
- Has this part of the codebase been failing consistently across the previous sprints?
- Is the defect rate going up or down since the last build?
- How many open issues sit directly in high-priority user flows?
Every QA lead asks some version of these before every release.
The problem is that most tools make you answer them manually. You pull from multiple places, piece together a picture, and write a status update that nobody fully trusts by the time it reaches a decision-maker.
The World Quality Report 2025–26 found that 94% of organizations review production data before making testing decisions. Close to half still struggle to turn that data into a clear action. The data is not the missing piece. The link between data and decision is.
A Decision Tool Is a Different Category of Thing
A decision tool is not a smarter dashboard. It is not more metrics or prettier charts. It is built around a different question. Not “what happened?” but “what do we do next?”
Context Over Metrics
A dashboard shows numbers. A decision tool shows what those numbers mean.
Here is what that looks like in practice:
- A dashboard shows 87% of tests passed. A decision tool tells you that the 13% that failed are sitting in your payment flow.
- A dashboard shows 14 open defects. A decision tool shows 9 of them are tied to requirements with no passing coverage before Friday’s release.
- A dashboard shows test execution is complete. A decision tool shows that three user flows were never verified this cycle.
A QA manager using a dashboard still has to build the story. A QA manager using a decision tool gets the story and focuses on what to do about it.
One Source of Truth for Everyone Involved
Building that story takes time. It also creates gaps. When three people read the same raw data and interpret it separately, your release review turns into a debate about what the numbers mean. Not a clear go or no-go.
A decision tool cuts that out. Everyone sees the same view of coverage, risk, and readiness. Before the meeting. Not during it.
Where Test Management Becomes the Operational Core
Most teams use test management as a storage system. A place to keep cases organized and results logged.
That is a limited use of what it can do. When it connects to requirements and releases, it becomes the backbone of every release decision.
Traceability That Runs Automatically
When test cases are tied to requirements, and requirements are tied to releases, traceability happens on its own.
Nobody manually maps what was tested against what was promised. The system shows coverage, open items, and where the risk is. In real time.
The downstream impact is real:
- Engineers see the same coverage view as QA leads, without waiting on a status update.
- QA leads can brief stakeholders without rebuilding a report each cycle.
- When a defect shows up after release, the traceback to what was and was not tested already exists.
This is not a workflow tweak. It is a fundamental change in how release decisions get made.
The Overhead Nobody Names
There is a cost that never shows up in any QA report. But almost every QA lead feels it. It is the time spent manually building the release picture before every cycle. And it is bigger than most teams admit.
Pre-Release Assembly Work Is a Hidden Cost
Most teams have someone, usually the QA lead, spending two to four hours before every major release just pulling things together. Their job is:
- Exporting data
- Filtering results
- Cross-checking coverage against a requirements list that lives somewhere else
- Writing a summary that stakeholders skim in thirty seconds
That work goes away when the platform connects those pieces natively. Coverage maps to requirements. Requirements map to releases. The pre-release picture is already there. The QA lead uses that time on actual judgment. Not on building a document about quality.
Do that across a twelve-sprint year, and the time recovery adds up fast. More importantly, the release decision gets better. Because it comes from a complete, structured view instead of one person piecing things together under deadline pressure.
Kualitee connects test execution to requirements automatically – so your team spends less time reporting and more time deciding.
What This Looks Like in Practice
The gap between a dashboard and a decision tool is easiest to see at the moment that matters most. The hour before a release.
From Data List to Coverage Map
A team running 400 test cases per sprint across six feature areas has no shortage of data. But without traceability, those 400 cases are just a list. Someone still has to figure out what they mean by the features being shipped.
From Status Update to Release Decision
Put those same cases inside a platform that connects execution to requirements and flags coverage gaps by feature area, and the conversation changes. It goes from “let me pull the numbers together” to “here is the readiness view, what do we do about these three open items in the checkout flow?”
That is the real difference. Not more data. Faster decisions, with more confidence behind them.
Release Confidence Is a System Output, Not a Gut Call
The teams that ship consistently, no last-minute scrambles, no post-release surprises, are not the ones with the most tests. They are the ones with the clearest picture of what their tests mean.
That picture takes more than a dashboard. It takes a platform built around the question every QA manager is already asking:
Are we ready to ship, and how do we actually know?
Kualitee is built around that question. It connects execution to requirements, surfaces coverage gaps before they become release risks, and gives engineers, QA leads, and product managers a shared view of readiness. Not competing reads of the same raw data.
If your setup still requires someone to manually build that picture before every release, that is the gap Kualitee closes.