
With many moving parts of a testing project, you may find yourself swamped with work and yet answering for delays and slipped defects. As a tester (both beginner and professional), measuring software quality is often a huge challenge.
To thrive in the competitive QA market, testers must define key performance indicators (KPIs) to gauge the progress of software testing. Especially in terms of test coverage, speed of execution and defect status.
Testers are now more meticulous about quality over quantity. The end goal is not picking out bugs, but to have an excellent end-user experience.
The often-heard quote of W. Edwards Deming, a quality-control leader, aptly captures the importance of KPIs:
“We cannot control things which we cannot measure.”
Considering this, QA metrics and KPIs are the backbone of any successful quality assurance strategy. This guide will walk you through the definitions, types and practical applications of QA metrics and KPIs. By the end, you’ll be able to build a robust measurement framework that supports both team growth and organizational success.
Key Takeaways
- QA metrics and KPIs are not the same. Metrics show activity, KPIs show impact tied to business goals.
- A balanced QA strategy requires both quantitative numbers and qualitative insights to understand performance and user experience together.
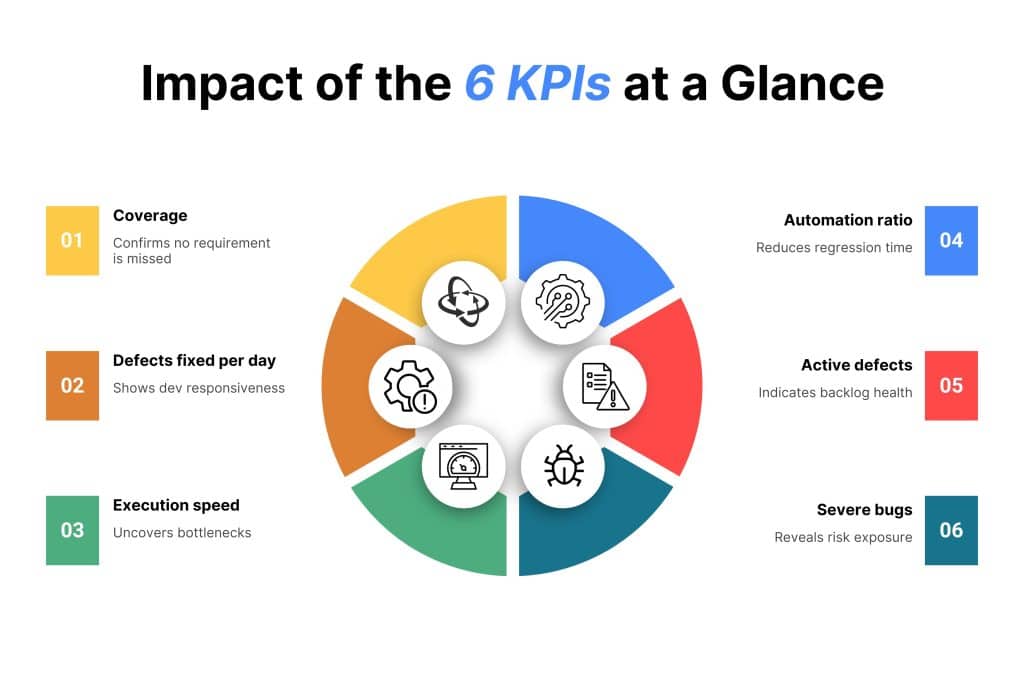
- The six core KPIs for testers help drive real outcomes: coverage, execution speed, automation ratio, defect resolution, active defects and severe bug control.
- KPIs only matter when reviewed consistently and used to guide decisions in every sprint, not when collected for reporting alone.
- The goal of QA measurement is progress and product quality, not pressure on individuals. Teams grow when KPIs drive learning, not blame.
Understanding QA Metrics and KPIs
Before diving into specific metrics, it’s important to understand the distinction between QA metrics and KPIs.
QA metrics are quantifiable measures that track various aspects of the testing process. These include:
- Test coverage
- Defect density
- Execution speed
These metrics provide a snapshot of current performance and help identify trends over time.
KPIs (Key Performance Indicators), on the other hand, are a subset of metrics that are directly tied to business objectives and quality goals. KPIs are the most critical metrics that indicate whether your QA efforts are delivering the desired outcomes.
For example, while “defects detected per cycle” is a metric, “percentage of critical defects fixed before release” is a KPI. And that’s because it reflects the success level needed by stakeholders and customers.
| Category | Meaning | Example | What it tells you |
| QA Metric | A measurable value that tracks part of the testing process | Number of defects found in a sprint | Shows how many issues were detected but not whether they were resolved in time |
| QA Metric | A data point that reflects effort or activity | Test case execution rate | Shows speed of execution but not impact on release quality |
| KPI | A metric tied to business and quality goals | Percentage of critical defects fixed before release | Shows whether the product meets release standards and customer expectations |
| KPI | A metric that reflects the outcome of QA efforts | Reduction in escaped defects over three releases | Shows improvement in product quality and user experience |
Track every metric and KPI with complete traceability using Kualitee’s real-time reporting and dashboards. Book a demo to see it live.
Understanding this distinction is crucial for building a balanced QA strategy. All in all, metrics provide the raw data, while KPIs help you focus on what truly matters for your organization.
Types of QA Metrics and KPIs: Quantitative vs. Qualitative Approaches
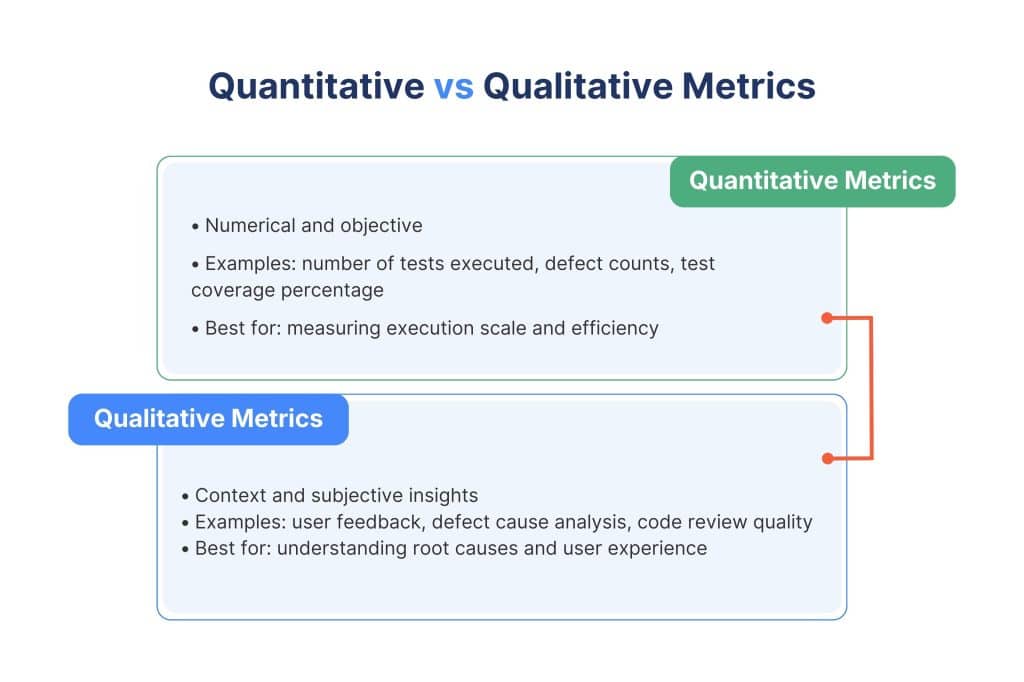
QA metrics and KPIs can be broadly categorized into quantitative and qualitative approaches.
So, first one, quantitative metrics are numerical values that can be easily measured and tracked. Such as:
- Number of tests executed
- Defect counts
- Test coverage percentage
These metrics provide objective, data-driven insights into the efficiency and effectiveness of your QA processes.
When it comes to qualitative metrics, they assess the nature and impact of issues or processes. These metrics often come from user feedback, defect cause analysis or code review quality.
Also, while qualitative metrics are harder to measure, they provide valuable context and help you understand the “why” behind the numbers.
The differences are pretty clear. But you should note that a balanced QA strategy blends both quantitative and qualitative metrics.
Since quantitative metrics offer objectivity, along with consistency, and qualitative insights capture the nuances of user experience as well as process improvement, they’re a good combo. Together, they create a holistic view of your QA performance.
Essential QA Metrics to Track in Your Software Testing Process
To build a good QA measurement framework, focus on the following essential QA metrics and KPIs.
Each metric includes a definition, calculation formula and practical use case to help you get started.
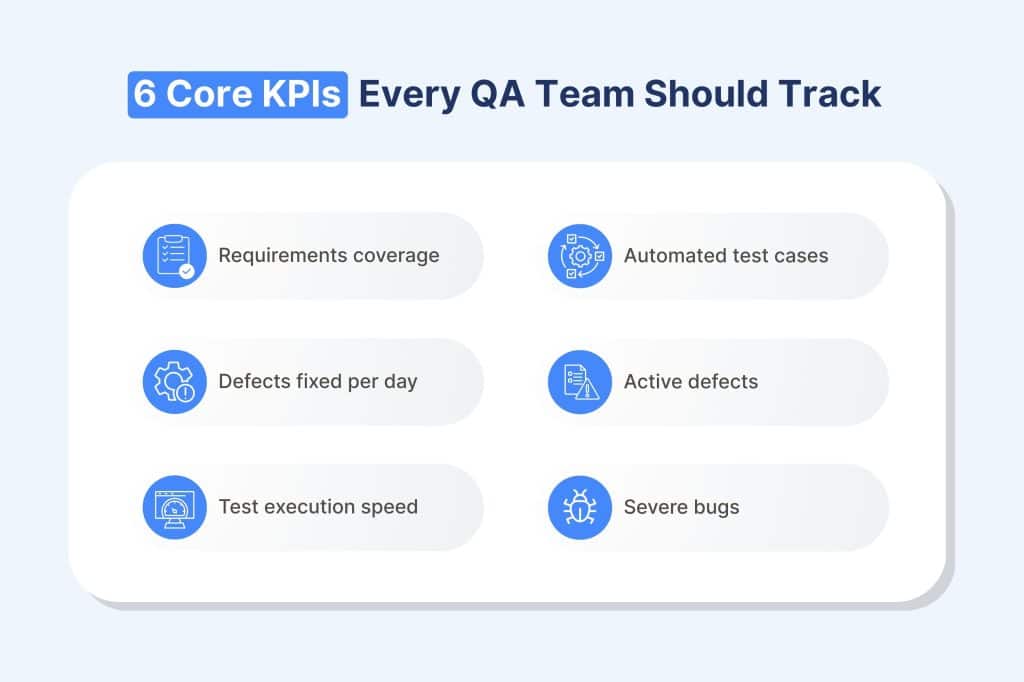
1. Requirements coverage (%)
This KPI measures the number of tests associated with a user story or requirements. A test manager assures that all the feature requirements are linked with their respective test cases and vice versa. The practice ensures that all requirements have a sufficient number of tests.
As a test manager, you can supervise this KPI to trace the total number of tests assigned against requirements for an optimized testing process.
Formula: Number of requirements with test cases/ Total requirements* 100
Target: 95%+ for mature teams.
Use case: Ensures comprehensive test coverage and helps identify gaps in requirements.
2. Defects fixed per day
Keep an eye on how quickly the development team works to fix the issues your QA team has reported. The KPI for QA testers allows you to keep track of total defects fixed per day as well as the efforts involved to correct a problem. The process assures that your production team is meeting the “norm” for fixing bugs and keeping the build going forward.
Formula: Defects fixed in period/ Number of days*100
Typical target: 3-7 per day for balanced teams.
Use case: Monitors the efficiency of the development team and helps identify bottlenecks.
3. Test Execution Speed
With this KPI, testers can measure the test execution speed at different points in time. The indicator suggests the total number of manual and automated tests executed on a daily/weekly basis. This allows you to estimate the total time spent in test execution.
If this KPI is implemented correctly, you’ll clearly see the productivity of testers.
Use case: Tracks the speed of your testing process and helps identify bottlenecks.
4. Automated test cases
This indicator tells you the ratio of automated test cases versus the total sum of test cases.
Technically, a higher automated test case ratio means that automated regression cycles will cover larger areas of the app. This increases the likelihood of trapping critical defects from the software delivery pipeline.
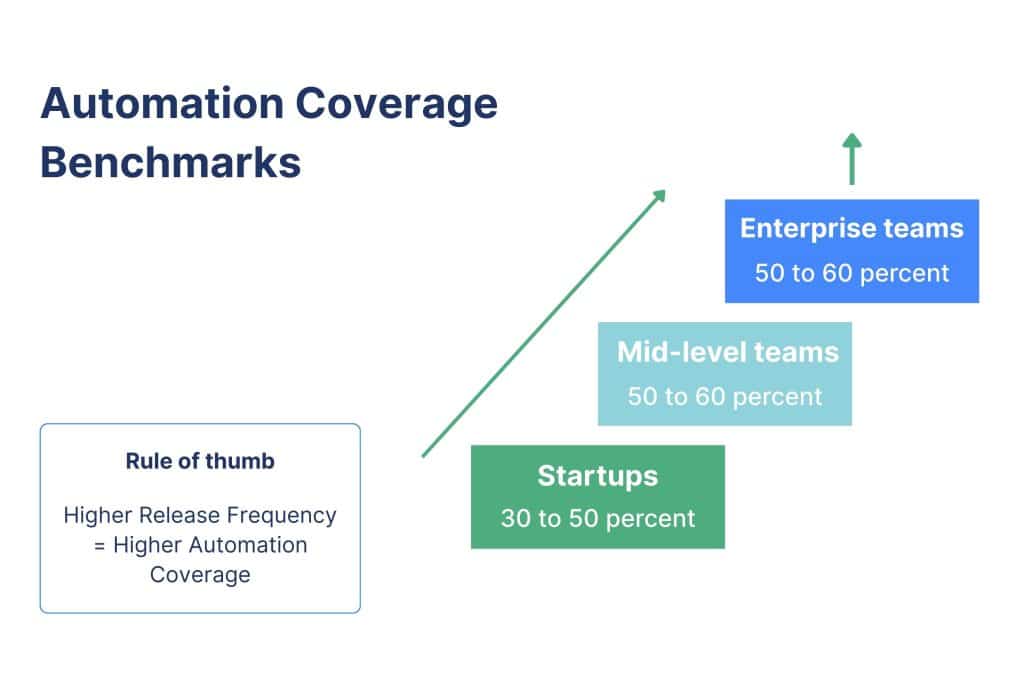
The percentage threshold for test automation is decided based on the extent of automation needed and the costs involved. For example, define the percentage of test cases you want to automate. And then increase/decrease considering your team’s resources, time and other measurable factors.
Formula: Automated test cases/ Total test cases*100
Benchmarks: Should be 30-50% for startups and 60-85% for enterprises.
Use case: Measures the efficiency of your automation efforts and helps free up resources for exploratory testing
5. Active defects
Defects that are not fixed and closed are called “Active Defects.” The KPI’s status can be new, open, or closed, but not verified. Test managers can set a KPI threshold for active defects, for example, 100 defects, 50 defects, or 25 defects. If the threshold value exceeds, you can initiate an urgent action. Keeping the level of the KPI value minimal for a smaller number of active defects adds a higher value to the end product.
Best practice: Set a threshold like <20 for smaller projects.
Use case: Helps prioritize defect resolution and ensures timely fixes.
6. Severe bugs
It is an excellent QA KPI that helps you define a threshold value for the number of severe bugs/defects in an app at a time. In case the threshold value of severe bugs exceeds the limit, you can launch an immediate action here as well.
Do note that before building the KPI, the testing team should have enough expertise in identifying severe defects correctly. Also, it is necessary to use checks and balances when determining a defect’s gravity.
Use case: Highlights critical issues that require urgent attention.
Speed up test execution and expand smart automation with Kualitee’s test management platform built for fast releases. Sign up and try it with your team.
Best Practices for Implementing and Monitoring QA Metrics & KPIs
Implementing and monitoring QA metrics and KPIs in your organization is a nuanced, strategic task. One that determines whether your quality assurance efforts will yield accountable insights and meaningful business value. Or just merely clutter your reports with irrelevant numbers.
Hence, it would only be fair if we told you some of the best practices that experts recommend for implementing and monitoring QA metrics and KPIs. They are as follows.
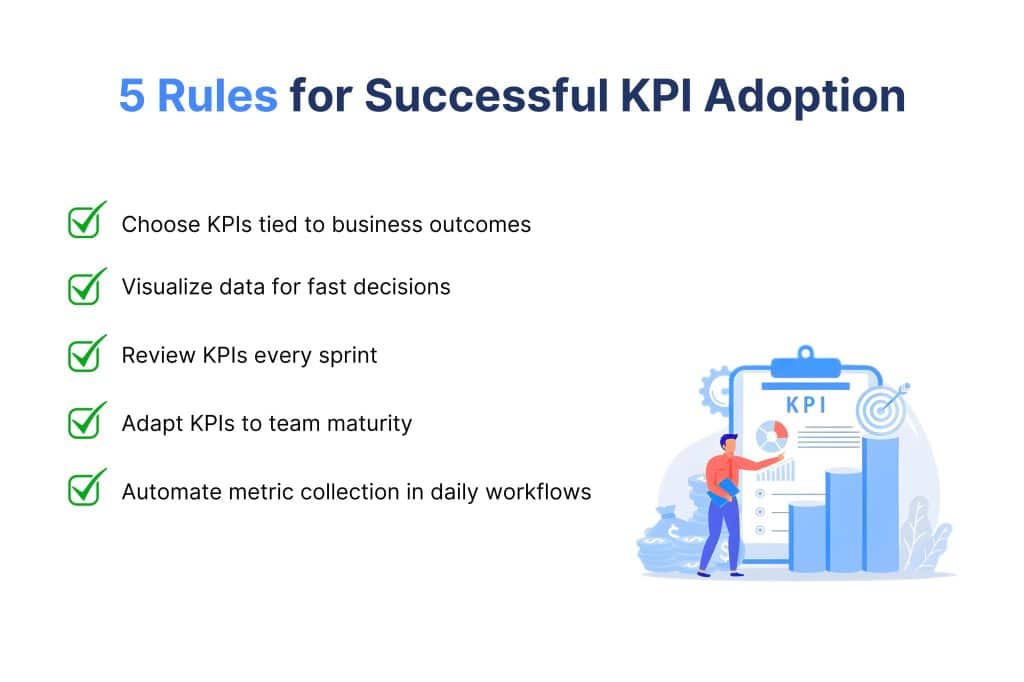
- Select Meaningful KPIs Aligned to Business Outcomes
You must begin by carefully selecting KPIs that truly reflect your organization’s objectives, rather than defaulting to commonly tracked vanity metrics. Such as “bugs logged per user.”
And remember, the metrics should translate into actionable insights. Ones that drive improved product quality and more efficient ground delivery.
Ground your KPI selection in your business context. Whether that’s reducing escaped defects, accelerating release frequency or increasing automation coverage. Also, ensure each KPO corresponds to a measurable goal that’s important to your stakeholders.
Furthermore, stakeholders don’t usually want to read unnecessary stuff, so avoid the “nice to know” data in favor of “need to act” indicators. This way, there won’t be a metric overload and loss of focus.
- Visualize Data for Clarity and Accessibility
Data can overwhelm or empower (We made this up, but it’s true), depending on how it’s presented.
Hence, invest in clear, intuitive dashboards that allow QA teams, developers, product managers and executives to explore data that’s relevant to their needs.
Show them interactive visualizations to facilitate self-service analysis and faster decision-making. Real-time or near-real-time dashboards integrated into your CI/CD pipelines or test management tools lead to better transparency. And also promote a data-driven culture.
Lastly, Visualization also helps contextualize trends and correlate metrics (e.g., automation coverage vs escaped defects).
- Review Regularly to Drive Iterative Improvement
The golden rule of KPIs is to never “set and forget.” Review them on a routine schedule. Whether every week, at the end of each sprint or monthly.
Use the metrics to talk about what is going well, where things are stuck and what needs to change.
These reviews help teams improve, as well as reset their priorities for achieving wins.
And most importantly, treat KPIs as a way to improve the work and the product. Do not use them to blame individuals. When the focus is on learning and progress, people stay honest, open and motivated to do better.
- Adapt Your KPIs to Project and Organizational Maturity
One size doesn’t fit all. Startups or emerging teams often emphasize defect triage, test coverage and speed of execution to build quality foundations.
More mature, enterprise organizations layer on advanced KPIs like defect escape rate, automation effectiveness and customer-reported issues. This helps them reflect complex risk profiles and regulatory demands.
Tailoring KPIs by project phase or organizational maturity avoids wasteful efforts on metrics that are irrelevant at a certain stage. The focus remains only on outcome-driven tracking.
- Integrate Metrics Collection Into Daily Workflows
Avoid siloed or after-the-fact reporting systems that depend on manual effort and hinder data accuracy. Instead, embed metrics gathering directly into everyday QA workflows and tools. These can be your test management platforms, CI/CD test suites and bug tracking systems.
Automated data collection reduces human error, accelerates reporting and also ensures consistent metric availability. Hence, you should provide teams with dashboards accessible within their usual environments to make metrics a natural part of daily decision-making. Rather than a separate, cumbersome chore.
Additional Tips to be Considered
- Champion Cross-Functional Involvement: Engage product management, development and customer support in defining and interpreting QA KPIs. This helps in broader buy-in and accurate context.
- Link Metrics to Outcomes: Wherever possible, tie KPIs to customer satisfaction, business revenue or operational costs to demonstrate QA’s tangible impact.
- Train Teams: Educate everyone involved on the meaning and implications of selected KPIs to ensure data literacy.
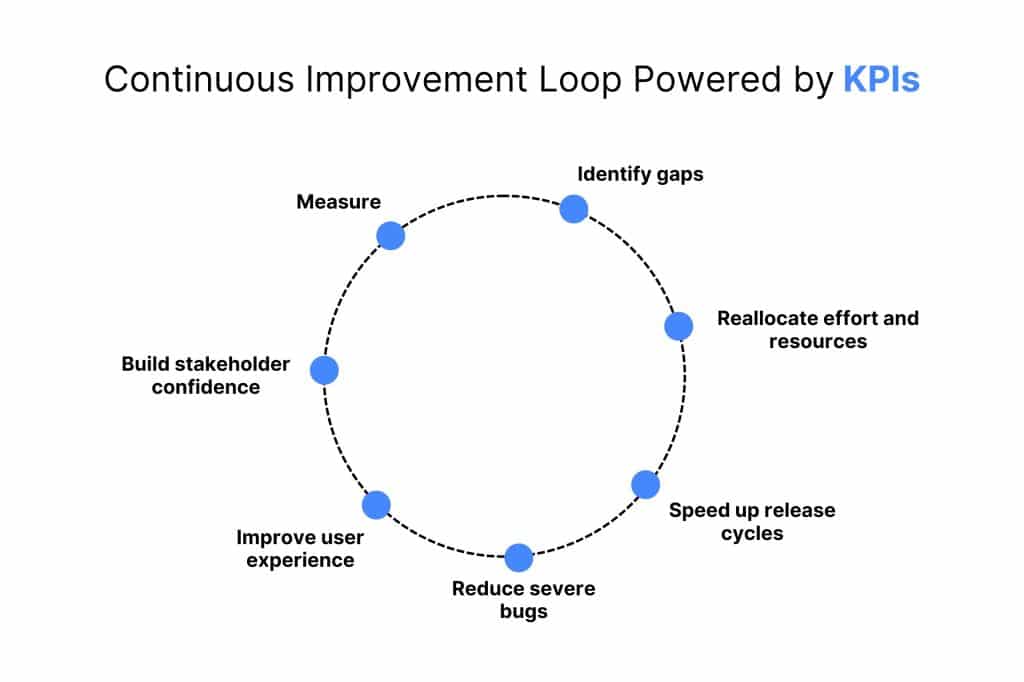
Leveraging QA KPIs for Continuous Improvement and Business Impact
Quality metrics only matter when they guide action. When QA teams track the right KPIs and use them to influence decisions in every sprint and release, they create a cycle of improvement that compounds over time.
Here is how KPIs can reshape the QA function:
- Identify Quality Gaps Early:
Testers and developers can use KPIs like defect density and escaped defects to detect process or product issues before they escalate.
- Accelerate Release Cycles:
If the focus is on automation coverage and test cycle time metrics, then testing can be sped up without compromising quality.
- Support Risk-Based Decisions:
Severe bug trends and defect escape rates can be visualized to assess release readiness quickly and prioritize testing effort effectively.
- Adjust Resources Dynamically:
KPI insights can be used to reallocate testing efforts. Not just that, automation can be increased and manual coverage can be expanded, based on the changing project needs.
- Build Stakeholder Trust:
QA metrics can be presented in business terms to non-technical leaders so that QA’s impact on product quality and customer satisfaction can be demonstrated.
- Create a Continuous Feedback Loop:
If you treat KPIs as living data that drive retrospectives and inform process improvements, a culture of ongoing quality enhancement can be established.
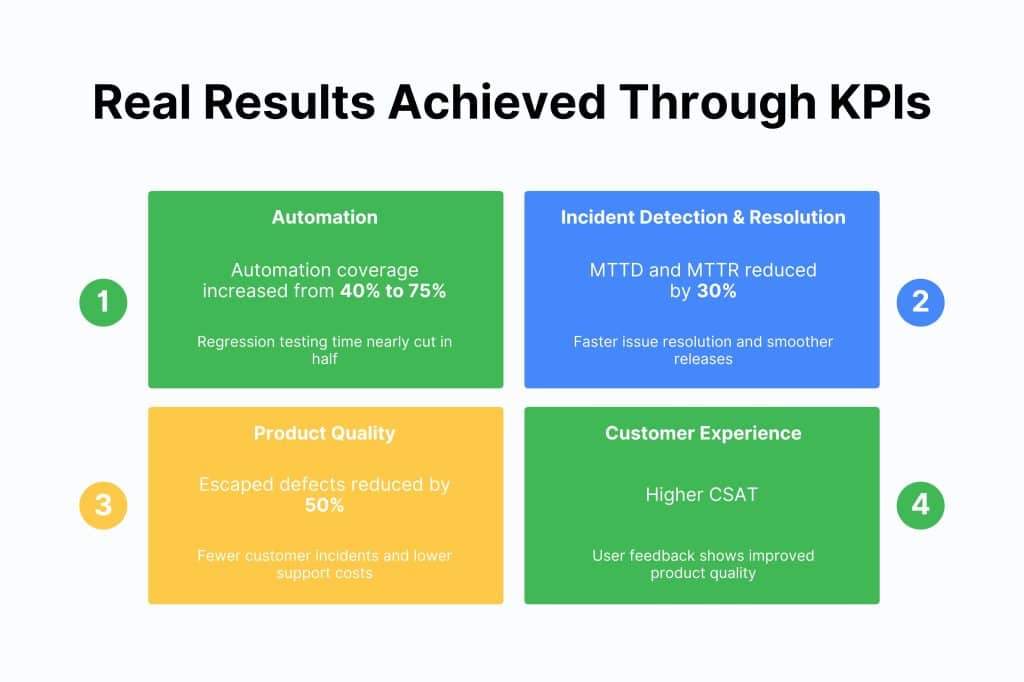
Examples of KPIs Driving Continuous Improvement
- Test Automation Coverage: Increasing from 40% to 75% can halve regression cycle times, as per the paper on the impacts of test automation on software’s cost, quality, and time to market by Divya Kumar.
- Mean Time to Detect/Repair: According to Krishna Vinnakota’s paper on how to reduce MTTR, bringing down MTTD and MTTR by 30% accelerates issue resolution and release readiness.
- Defect Escape Rate: It’s mentioned in the paper on root cause and escape defect analysis by Oulu University of Applied Sciences that lowering release escape defects by 50% improves customer experience and reduces support costs.
- Customer Satisfaction Score (CSAT): Functionize says that directly linking quality improvements to positive user feedback validates QA efforts
Give leadership a clear view of release readiness and product quality with Kualitee’s customized reports and analytics.
Measuring QA Success: Challenges & Considerations
Measuring the success of QA through metrics and KPIs is critical. But it also faces several practical challenges that teams must navigate to realize their full value. Some of those challenges are:
- Uncertainty About Meaningful KPIs
Many testers feel overwhelmed and are unsure which KPIs to prioritize. As one user put it, “What are some of the KPIs you guys use…? I don’t feel like I’ve covered enough ground.”
This shows the uncertainty that often stems from the abundance of potential metrics and the lack of clear guidance.
- Pressure Without Experience and Support
New QA leads often face pressure to define KPIs without adequate experience. A common voice from Reddit is, “My boss would like me to come up with all the KPIs… I have no previous professional experience…”
This can lead to stress and ineffective metric selection early on.
- Misuse of KPIs to Appraise Individuals
There is frequent disagreement about using KPIs for individual evaluation. One user even said, “I personally disagree to measure the performance by KPI.”
This warns against punitive or overly simplistic interpretations of metrics, emphasizing that KPIs should drive process improvements and not personal judgements.
- Lack of Data and Measurement Infrastructure
Many QA teams struggle with sparse metrics availability. As expressed by one: “My job doesn’t have much metrics… Only tracked time on a ticket.”
Without proper tooling and integration, data can be incomplete or inaccurate. This will, in turn, limit insight reliability.
- Difficulty Defining ROI Beyond Automation
Teams often find it hard to quantify QA’s financial contribution. A common sentiment is, “Unsure how to measure ROI for QA in general, other than… risk mitigation.”
This shows the challenge of capturing QA’s preventative value in traditional ROI terms.
- Vanity and Non-Actionable Metrics
There’s growing frustration with metrics that do not inform action. One user said, “Most of the team performance metrics like number of reopened or bugs logged per tester are non-actionable…”
This calls for careful KPI selections focused on metrics that drive improvements.
Considerations
Addressing these challenges requires a thoughtful, people-centered approach. You have to:
- Provide clear KPI frameworks
- Invest in a robust reporting infrastructure
- Pair quantitative metrics with qualitative context
- Educate stakeholders
- Foster a culture where KPIs drive learning and collaboration
Teams that achieve this balance report stronger release confidence, fewer incidents and improved product quality.
Final Words
Quality comes from discipline, not luck. Any team can collect numbers. But only teams that act on QA metrics and KPIs actually improve.
The purpose of metrics is simple: expose weak spots early, speed up delivery without lowering standards and protect the user experience.
When QAs align KPIs with business outcomes, as well as integrate them into daily work and review them consistently, quality becomes predictable rather than reactive.
The organizations that win tomorrow will be the ones that treat QA as a strategic investment, not a checkbox. Hence, if you want your releases to ship faster with fewer surprises, build a KPI framework and live by it.
Strengthen your releases with a platform that turns QA metrics into real outcomes. Check out Kualitee today and take a look at the difference yourself.
FAQs on QA Metrics and KPIs
Q) What are KPI metrics for QA?
They are the most important measurable outcomes that demonstrate QA’s effectiveness. Such as test coverage percentage and defect escape rate.
Q) What are QA metrics?
Any quantitative or qualitative measures related to software testing, from test pass rate to user satisfaction.
What are QA indicators?
Signals provided by metrics that alert teams to potential risks or opportunities for improvement, e.g., a sudden rise in open critical bugs.
What is an example of a QA indicator?
A high test automation rate paired with a low defect escape rate is a strong indicator of a robust QA process.