





Risk Matrix
Risk-Based Testing helps your team focus effort where it matters most. Instead of treating every requirement and test case the same, Kualitee lets you rate each one by how likely it is to fail and how much damage it would cause if it did, then uses that rating to guide your test strategy, prioritize execution, and report on coverage.
There’s no formula to memorize. Risk is a simple lookup: Probability × Damage resolves to a Risk Level from A to E, where A is the most critical and E is the least critical.
Step 1: Configure the Risk Matrix
The Risk Matrix defines what Probability and Damage mean for your organization and how they combine into a risk level. Only one matrix can be active at a time.
To configure the Risk Matrix:
- Go to Settings.
- Open the Risk Management: Risk Matrix tab. If you’re currently viewing Strategy, click the … next to the tab title and select Risk Matrix.
- Under Probability of Error, you’ll see three fixed rows: High, Medium, and Low. For each one, enter a Definition describing what that level means for your organization (for example, “High: the defect is very likely to occur based on complexity or past history”).
- Under Damage, do the same for its three fixed rows. Describe what High, Medium, and Low damage look like if a defect does occur (for example, “High: causes a full outage or data loss”).

- Click Save to store your definitions.
- Scroll down to Risk Mapping (Probability × Damage). This grid shows how every combination of Probability and Damage resolves to a Risk Level. The letters themselves (A–E) are fixed and can be viewed but not edited.
- Click Activate to make this matrix the one currently in effect across your organization.

Step 2: Define a Test Strategy for Your Project(s)
A Strategy tells Kualitee what testing response and coverage target you expect for each risk level. It can be applied to one or several projects at once.
To create a Strategy:
- Go to Settings › Risk Management, then click the … next to the tab title and select Strategy.
- Click + Create Strategy.
- Enter a Strategy Name.
- For each risk level (A through E, shown as colored badges), fill in:
- Testing Response: What kind of testing this risk level requires. Kualitee pre-fills sensible defaults you can edit.
- Target Coverage %: The percentage of test cases at that risk level you expect to execute.
- Select the project(s) this strategy should apply to.
- Click + Save.

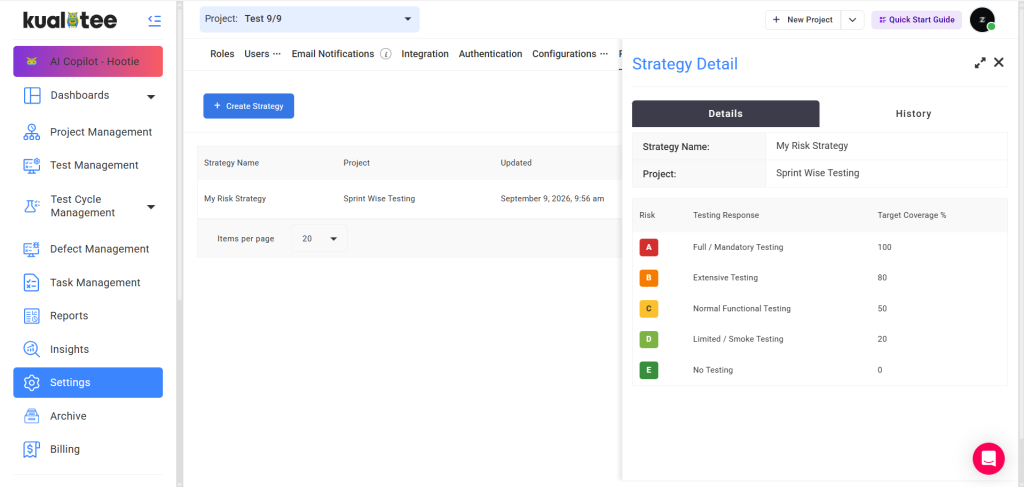
Kualitee’s default Testing Responses and Target Coverage values are:

Once saved, your strategy appears in the Strategy list, where you can open it at any time to review its details.

Step 3: Assess Risk at the Module Level
Once your Risk Matrix is active, every Module’s create/update screen includes a Risk Assessment card where you rate that module’s risk.
To assess a module’s risk:
- Go to Project Management › Module.
- Click + New Module, or open an existing module to edit it.
- Expand the Risk Assessment card if it’s collapsed.
- Select a value for Probability of Error (High / Medium / Low).
- Select a value for Damage (High / Medium / Low).
- Optionally, explain your reasoning in Probability Justification and Damage Justification – useful context for anyone reviewing the assessment later.
- Click + Save.
As soon as both Probability and Damage are selected, Kualitee looks up the active Risk Matrix and displays the resulting Risk Level badge automatically. You never need to calculate or enter this yourself.

Requirements and test cases work the same way. On the Requirement and Test Case screens, you can set Probability and Damage directly, just as you would on a Module – or you can inherit the risk from the level above (the module, for a requirement; the requirement, for a test case) by selecting the Link checkbox shown on that screen. With Link selected, the item’s risk stays in sync with its parent, so any change up the hierarchy carries down automatically. Leave it unselected, and the item keeps whatever risk you’ve set independently.
Filter Test Cases by Risk Level
During execution, you can narrow the test case list by risk. Open the filter panel, then use the Risk Level dropdown to show only the cases at a chosen level (A–E) – so your team can run the highest-risk cases first.

Risk Reports in Insights
For a project-wide view of how risk is distributed and how well it’s being tested, go to Insights › Risk Management.
- Optionally narrow the report by Cycle and/or Build using the filters at the top.
- Click Load reports.
You’ll see three reports:
- Distribution: A pie chart (with a matching table) showing how many test cases fall into each risk category: A, B, C, D, E, or Unassessed, along with the percentage each represents of your total test cases.
- Coverage vs Target: A bar chart (with a matching table) comparing the Target % from your project’s Strategy against the Actual % of test cases actually executed, for each risk level. The table also shows the Testing Response, Total, and Executed counts behind those percentages.
- Execution by Risk: A stacked bar chart (with a matching table) breaking down execution results – Passed, Failed, Not Run, and Other – grouped by risk letter, so you can see at a glance whether your highest-risk test cases are actually being run and passing.


User Guide
-
Dashboard
-
Project Management
-
Risk-Based Testing
-
Test Management
-
Hootie
-
Test Lab
-
Defect Management
-
Task Management
-
Reports
-
Insights
-
Settings
-
Integrations
-
SAML Authentications
-
Test Case Repositories