OVERVIEW
FEATURES


BY TEAM
BY WORKFLOW
Project Dashboard
Kualitee can be used in both darker and lighter themes. To change the theme, at the top right corner, click on the profile button, and then you can change the theme with the help of the toggle.
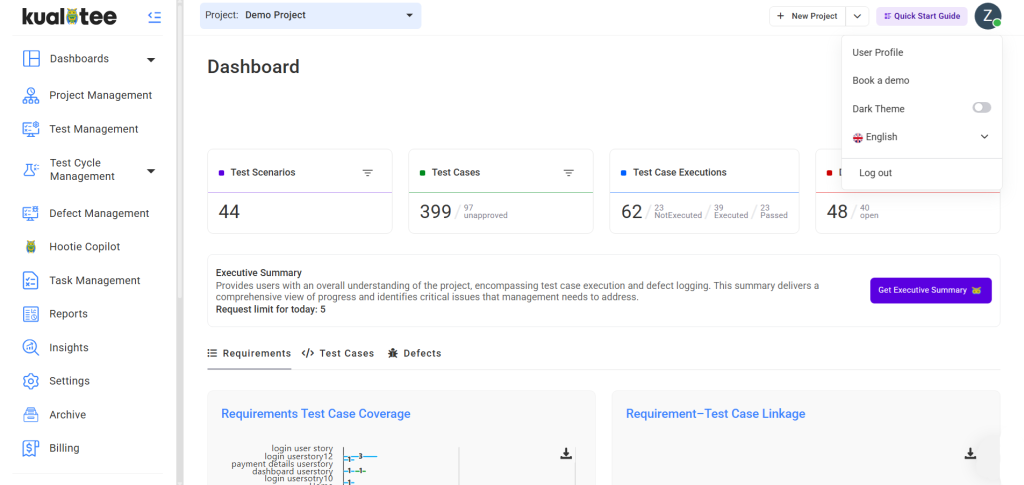
Four activities are shown here on the top of the dashboard, as follows:
- Test Scenarios: Stating the number of Test Scenarios against the project.
- Test Case: Stating the number of Test Cases against the project.
- Defects: Stating the number of Defects against the project.
- Test Case Execution: It shows the total number of executions against projects.
The following graphs are displayed.
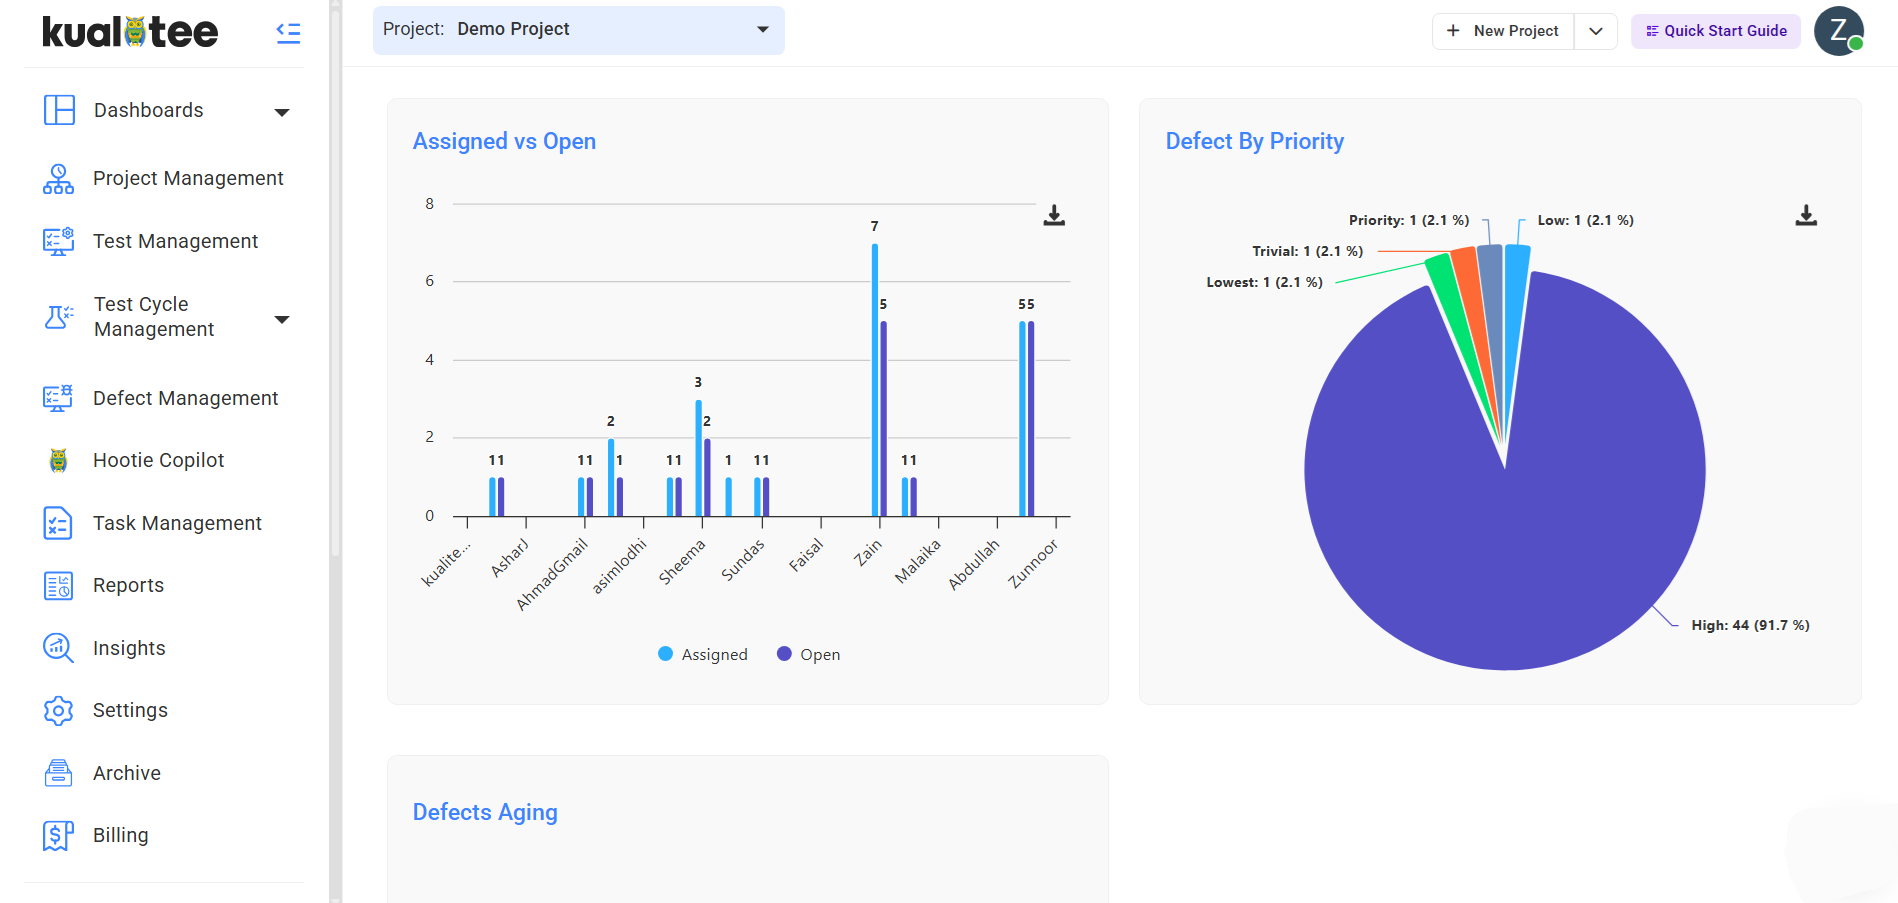
- Defects by Severity: Refers to the severity of the defect being logged with a filter.
- Defects by Status: Refers to the status of the defect logged with the filter.
- Defect Closure Efficiency: Shows the number of total defects and resolved defects.
- Active Defects: Shows the number of unresolved defects against specific intervals of time.
- Defects Reopened: Shows the percentage of defects reopened against specific intervals of time.
- Bug Fix Duration Days: Shows the number of days it took to fix a particular bug.
- Bugs Statistics: Shows the status of bugs – reported, fixed, open, and others.
- Assigned vs. Open Defects: Shows how many defects are assigned to each team member and how many of those defects remain in an open state. Use this to identify workload distribution and spot unassigned or stalled defects.
- Test Cases Status: Refers to the current status of the test case with the filter.
- Executed Test Cases: Refers to the test cases that have been executed with a filter.
- Test Case Progress: Shows the number of test cases executed at specific intervals of time.
- Test Cases Fail: Shows the percentage of failed test cases.
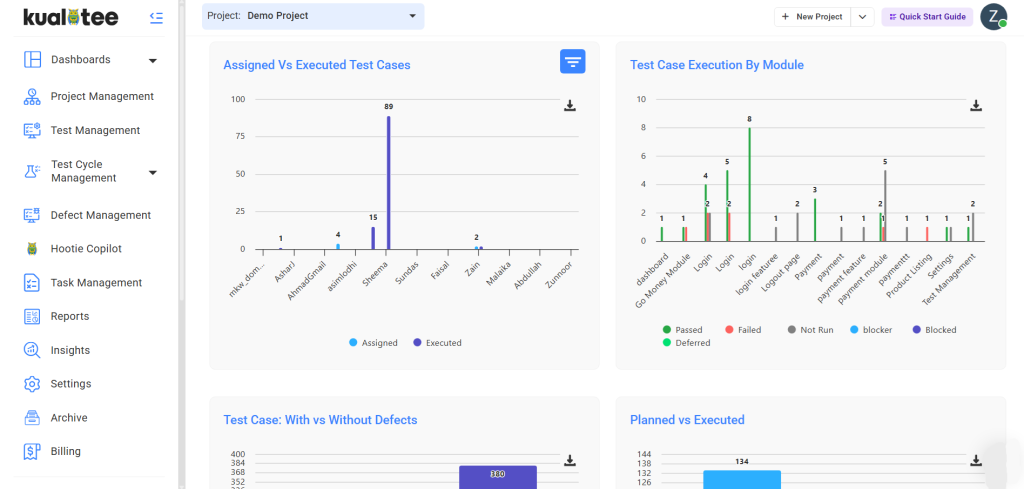
- No. of Test Cases Assigned vs No. of Test Case Executed by Tester
- Test Case Execution by Module: Shows test case execution count for each module. If a test case has been executed multiple times, it is counted once (unique count), and the latest execution result is shown.
- Test Cases With / Without Defects: Shows the total count of test cases that have associated defects versus those that do not.
- Planned vs. Execution: Shows how many test cases were planned or added to a cycle compared to how many were actually executed.
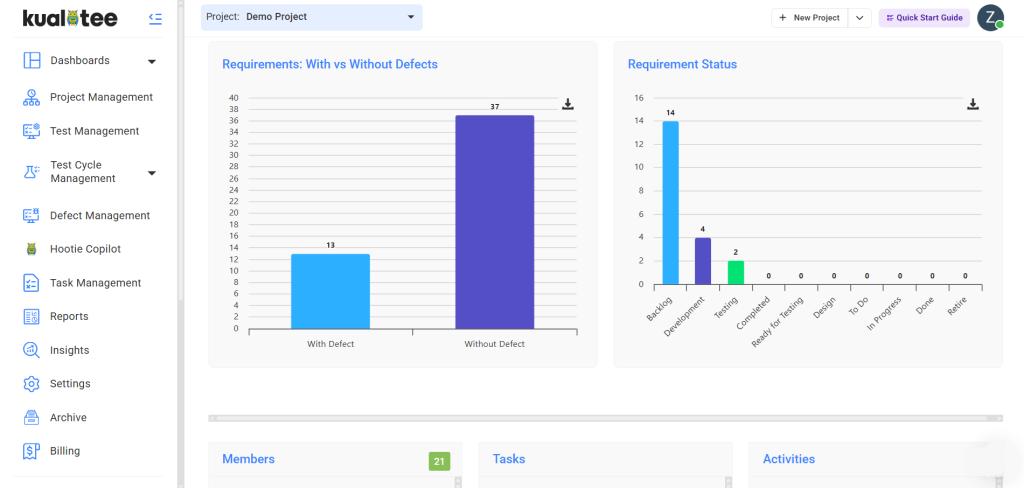
Requirements Test Case Coverage: Shows coverage of requirements against cases.
- Requirements Coverage: Shows which requirements have at least one linked test case and which do not. Requirements without linked test cases represent gaps in test coverage.
- Requirements With / Without Defects: Shows which requirements have defects attached to them and which are defect-free.
- Requirements by Status: Shows the breakdown of all requirements by their current status.
User Guide
-
Dashboard
-
Project Management
-
Test Management
-
Hootie
-
Test Lab
-
Defect Management
-
Task Management
-
Reports
-
Insights
-
Settings
-
Integrations
-
SAML Authentications
-
Test Case Repositories