OVERVIEW
FEATURES


BY TEAM
BY WORKFLOW
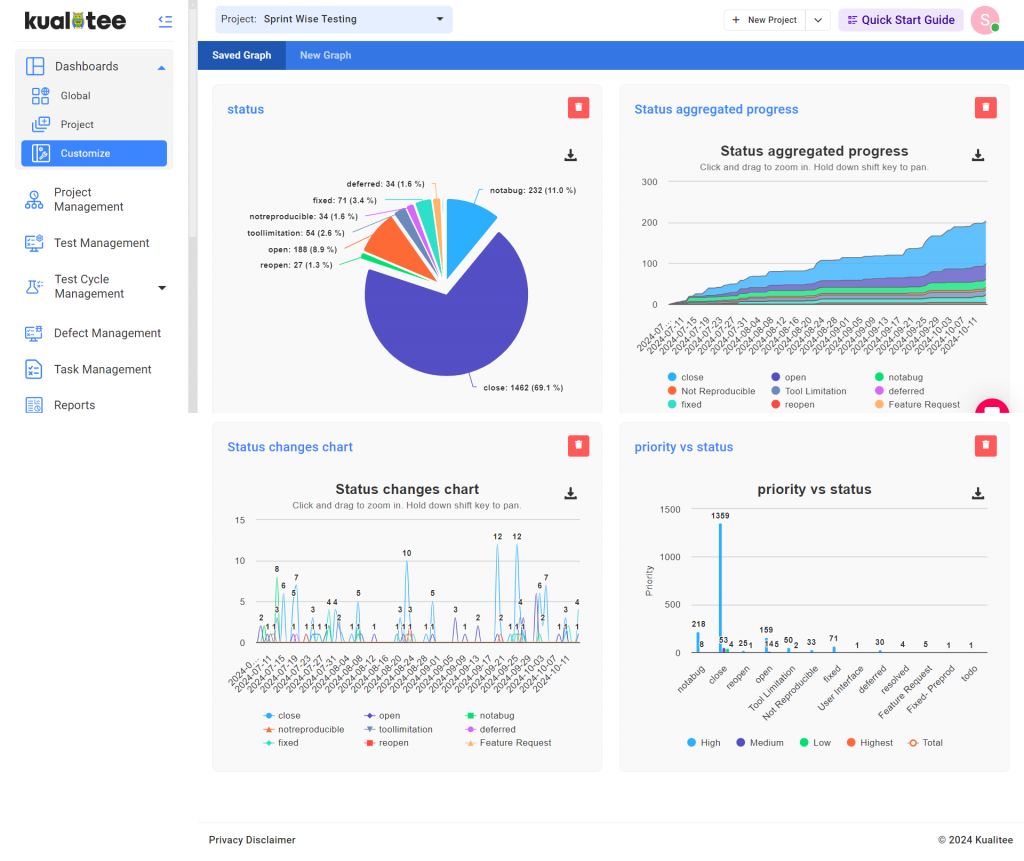
Customise Dashboard
Users can plot custom graphs based on the data provided. The page shows two fields:
1. Saved Graphs
2. New Graphs
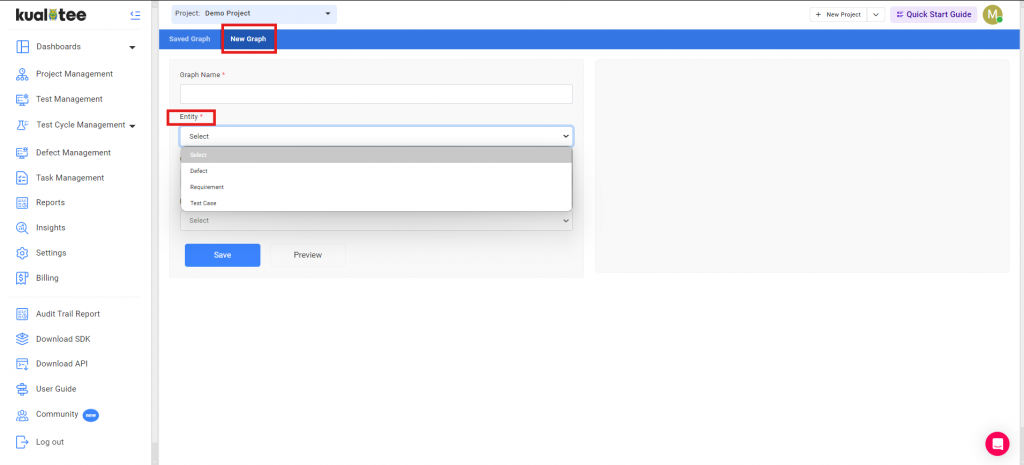
To create a new graph, click on the new graph.
Select the entity.
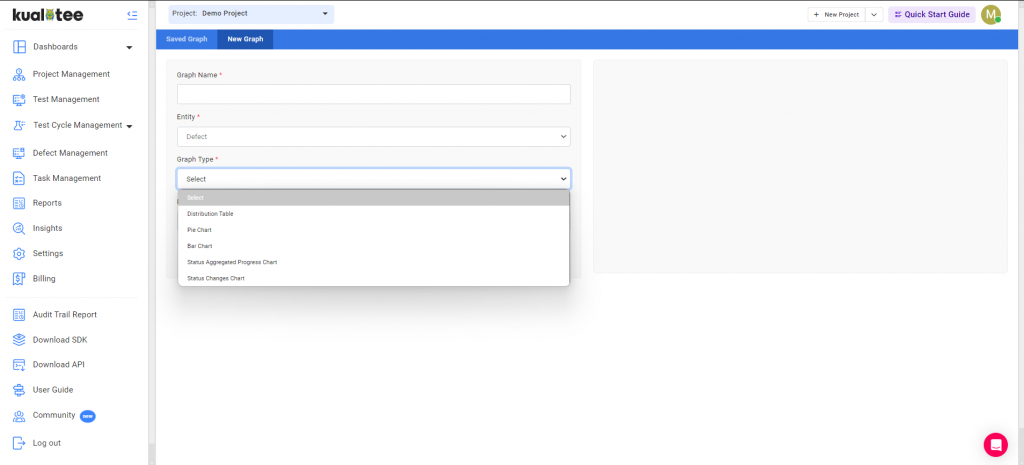
After selecting the entity you can select the graph type as per your requirement.
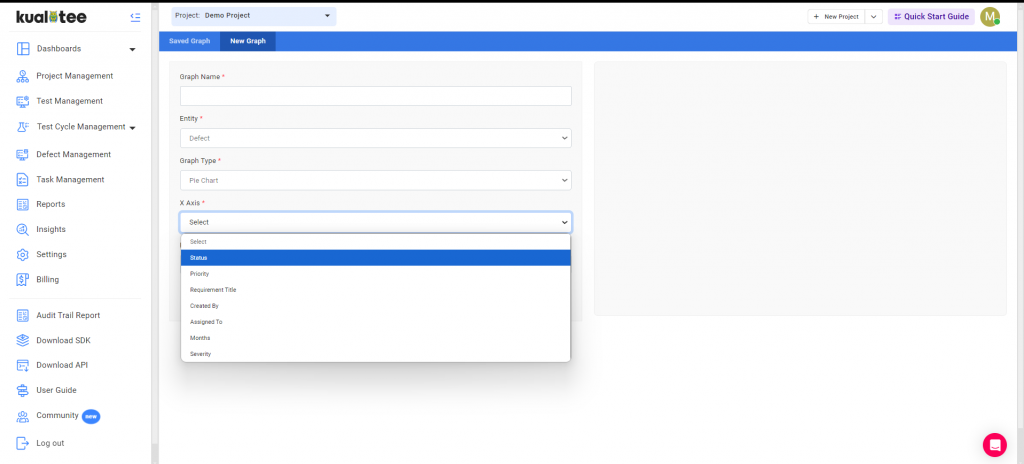
Then select the category to mention on the axis.
Then add the filter you require.
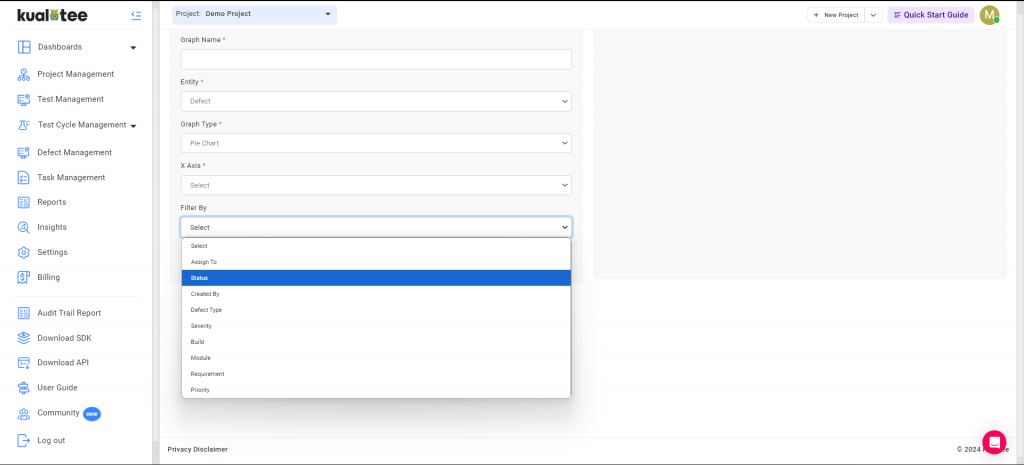
Then proceed to save the graph. You can view your graph in ‘saved graphs’.
User Guide
-
Dashboard
-
Project Management
-
Test Management
-
Hootie
-
Test Lab
-
Defect Management
-
Task Management
-
Reports
-
Insights
-
Settings
-
Integrations
-
SAML Authentications
-
Test Case Repositories