OVERVIEW
FEATURES


BY TEAM
BY WORKFLOW
Project Dashboard
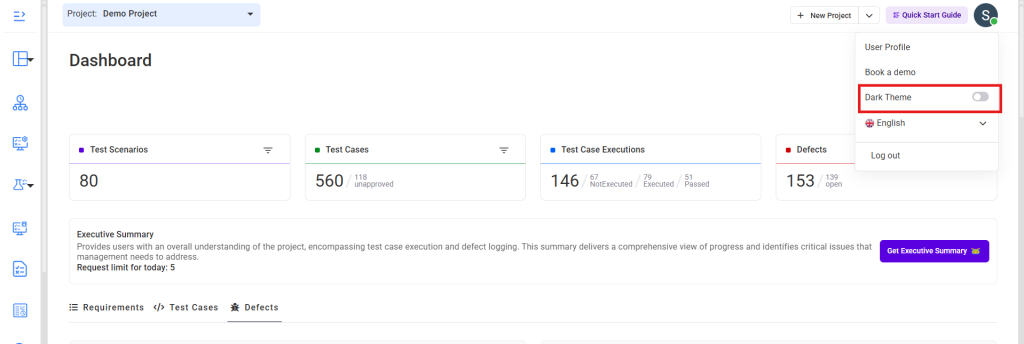
Kualitee can be used in both darker and lighter themes. To change the theme, at the top right corner click on the profile button and then you can change the theme with the help of toggle.
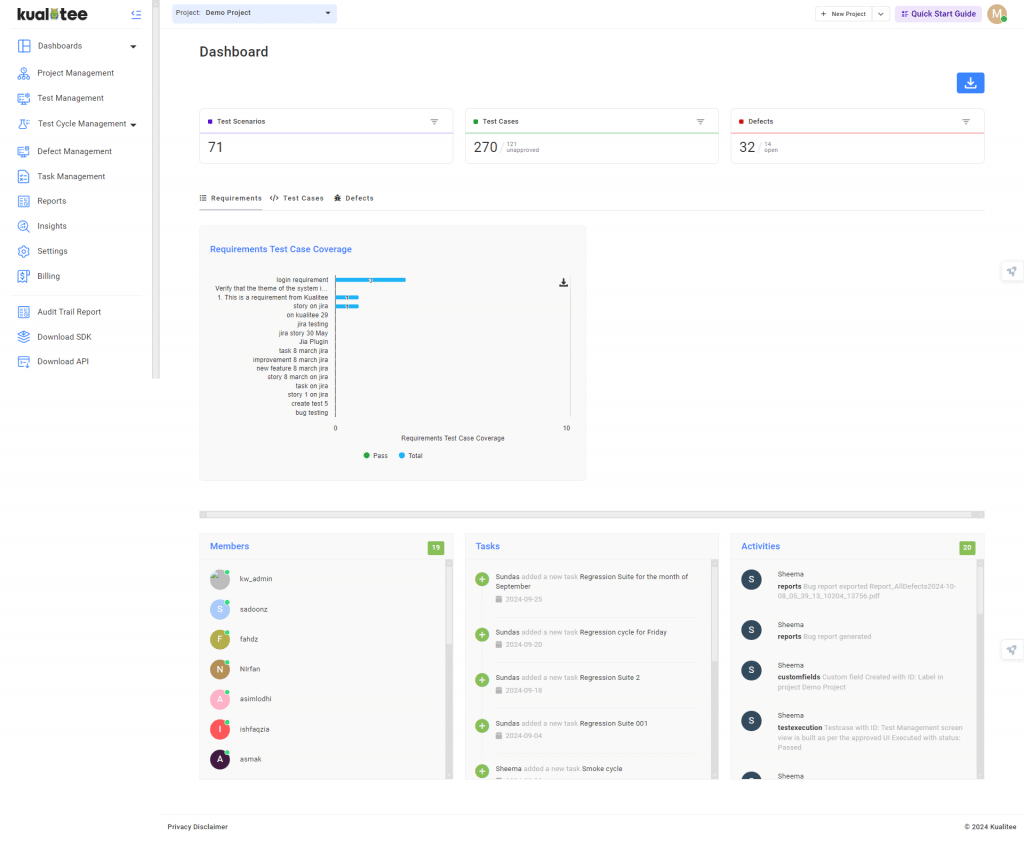
Four activities are shown here on the top of the dashboard, as follows:
Test scenarios: Stating number of Test Scenarios against project.
Test case: Stating number of Test Cases against project.
Defects: Stating number of Defects against project.
Test Case Execution: It shows the total number of executions against projects.
The following graphs are displayed.
- Defects by Severity: Refers to the severity of the defect being logged with filter.
- Defects by Status: Refers to status of the defect logged with filter.
- Defect Closure Efficiency: Shows number of total defects and resolved defects.
- Active Defects: Shows number of unresolved defects against specific intervals of time.
- Defects Reopened: Shows percentage of defects reopened against specific intervals of time.
- Bug Fix Duration Days: Shows the number of days it took to fix a particular bug.
- Bugs Statistics: Shows status of bugs – reported, fixed, open and others.
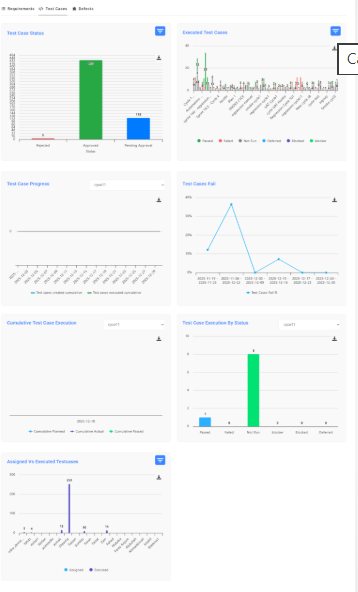
- Test Cases Status: Refers to the current status of the test case with filter.
- Executed Test Cases: Refers to the test cases which have been executed with filter.
- Test Case Progress: Shows number of test cases executed at specific intervals of time.
- Test Cases Fail: Shows percentage of failed test cases.
- No. of Test Cases Assigned vs No. of Test Case Executed by Tester
Requirements Test Case Coverage: Shows coverage of requirements against cases.
User Guide
-
Dashboard
-
Project Management
-
Test Management
-
Hootie
-
Test Lab
-
Defect Management
-
Task Management
-
Reports
-
Insights
-
Settings
-
Integrations
-
SAML Authentications
-
Test Case Repositories