


Global Dashboard
Kualitee’s Global Dashboard provides you with a single place to track and review data across all the projects you are part of. From defects to executions, you can access reports and apply filters for a deep analysis.
1. Viewing Defects Overview

In this section, you can see the total defects and open defects across all projects. There are also visual charts that show defects reported by status, type, and severity.
How to Use it:
- Apply filters on the left panel to select specific projects or define a date range.
- Click Search to update results or Clear All to reset.
2. Reviewing Bug Reports

The Bug Reports tab lists each defect in detail. Here, you’ll find things like the defect ID, description, type, priority, severity, and current status. Moreover, the associated build/module, who reported the defect, and when is also mentioned.
How to Use it:
- Use the filters (project, date range) to locate specific defects.
- You can also download the dashboard in CSV format for further analysis.
3. Accessing Test Cases
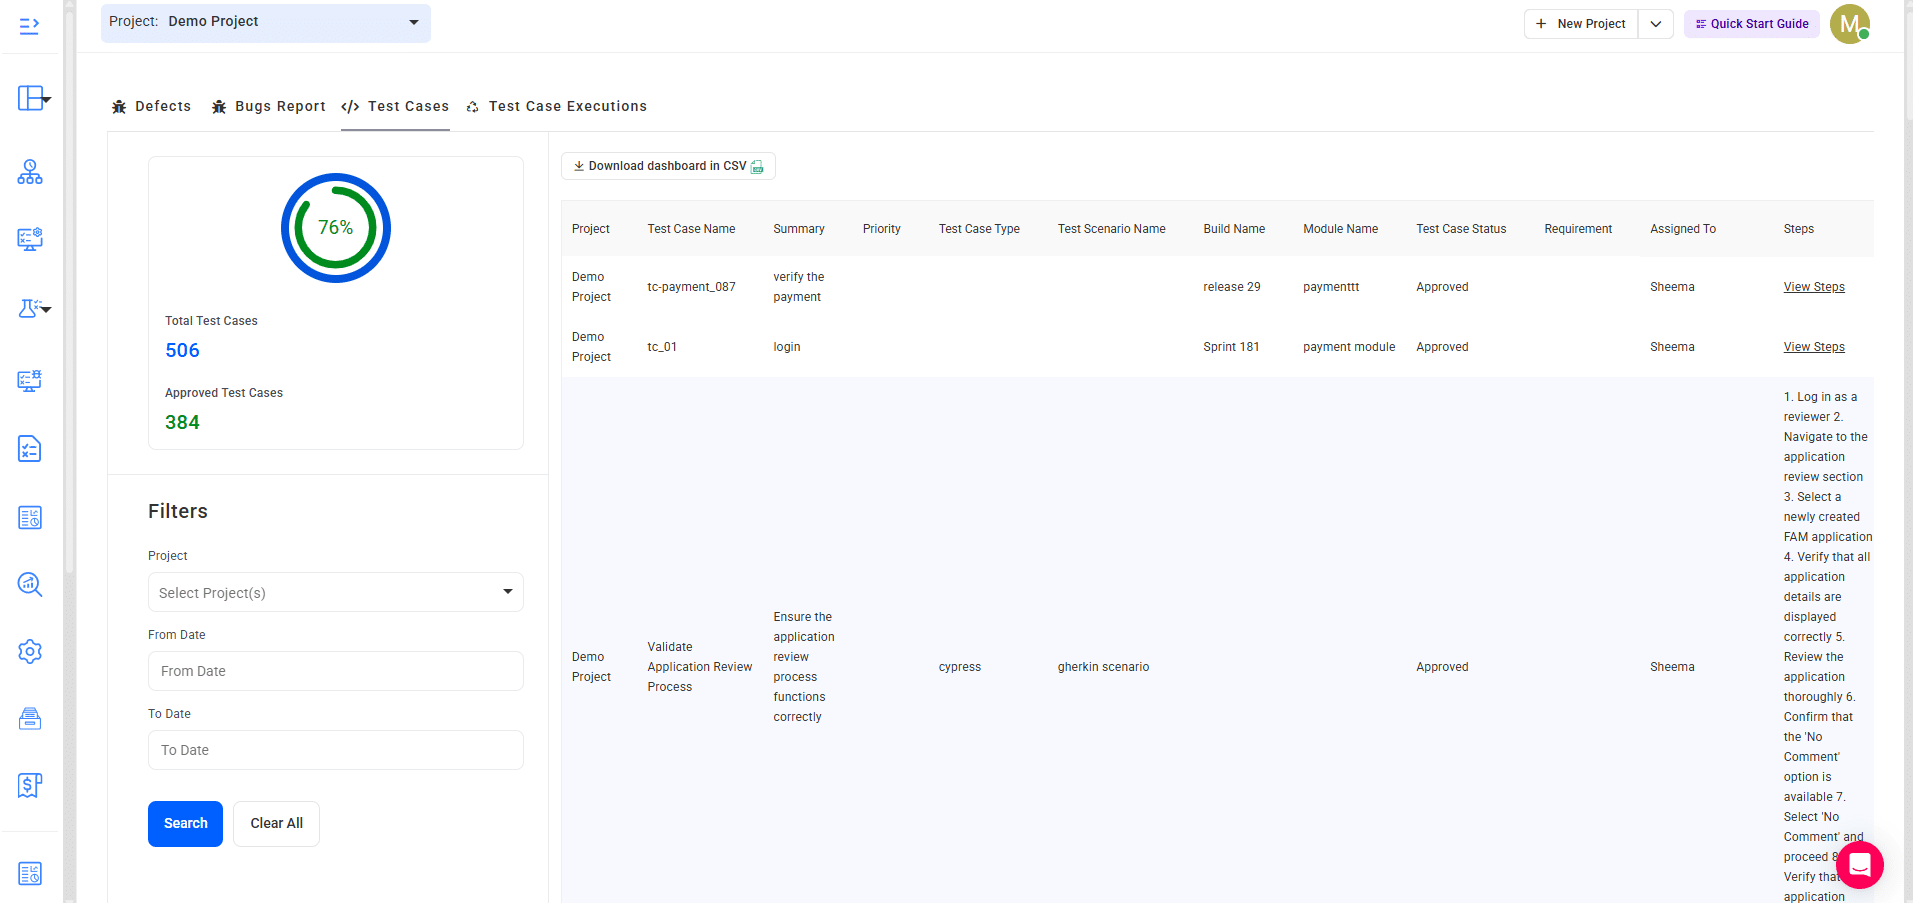
This section highlights the total number of test cases and the number of approved test cases.
The details for each case, including test case name, summary, type, scenario, build, requirement, assigned user, and steps, are also present here.
How to Use it:
- Apply project and date filters to refine the test case list.
- Click View Steps to see step-by-step instructions for each case.
- Export the dashboards as CSV if needed.
4. Tracking Test Case Executions
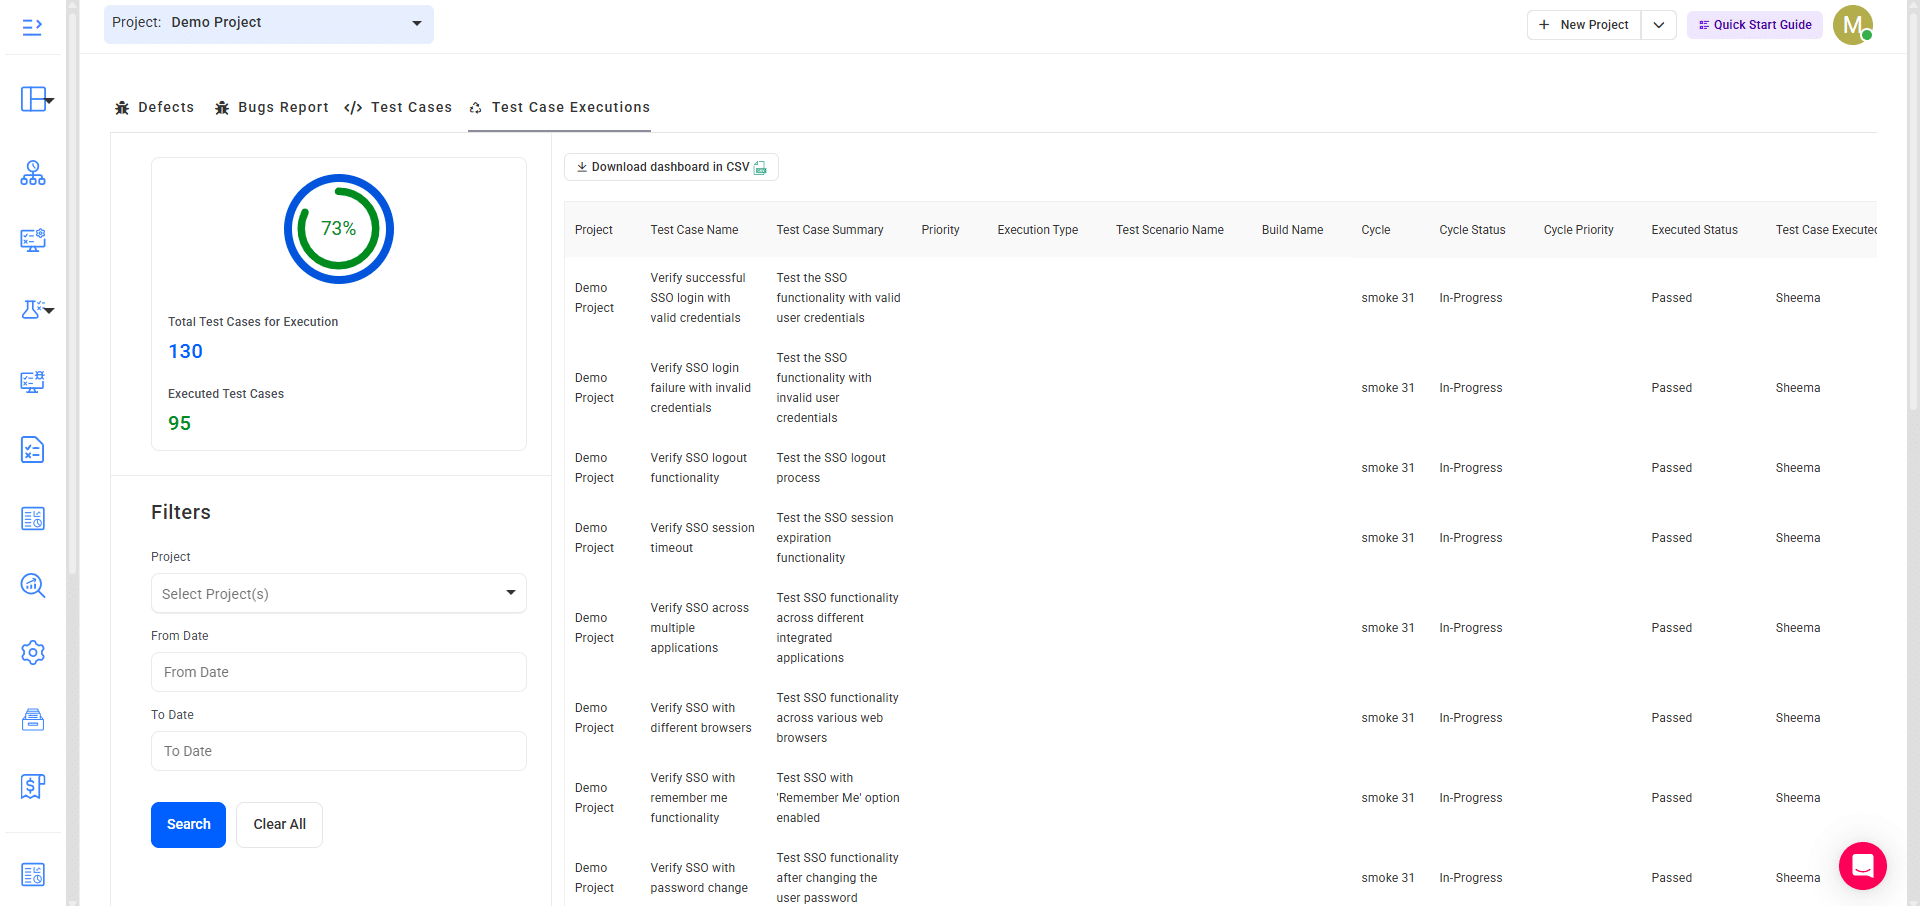
In the Executions tab, you can monitor the total test cases that are planned for execution and also those that are already executed. The results, such as passed, failed, or in progress, of the executed test cases can be seen too.
How to Use it:
- Select Project(s) and date filters to narrow down execution reports.
- Review execution details, including scenario, build, cycle, and execution status.
- Export execution data to CSV for reporting purposes.
User Guide
-
Dashboard
-
Project Management
-
Test Management
-
Hootie
-
Test Lab
-
Defect Management
-
Task Management
-
Reports
-
Insights
-
Settings
-
Integrations
-
SAML Authentications
-
Test Case Repositories